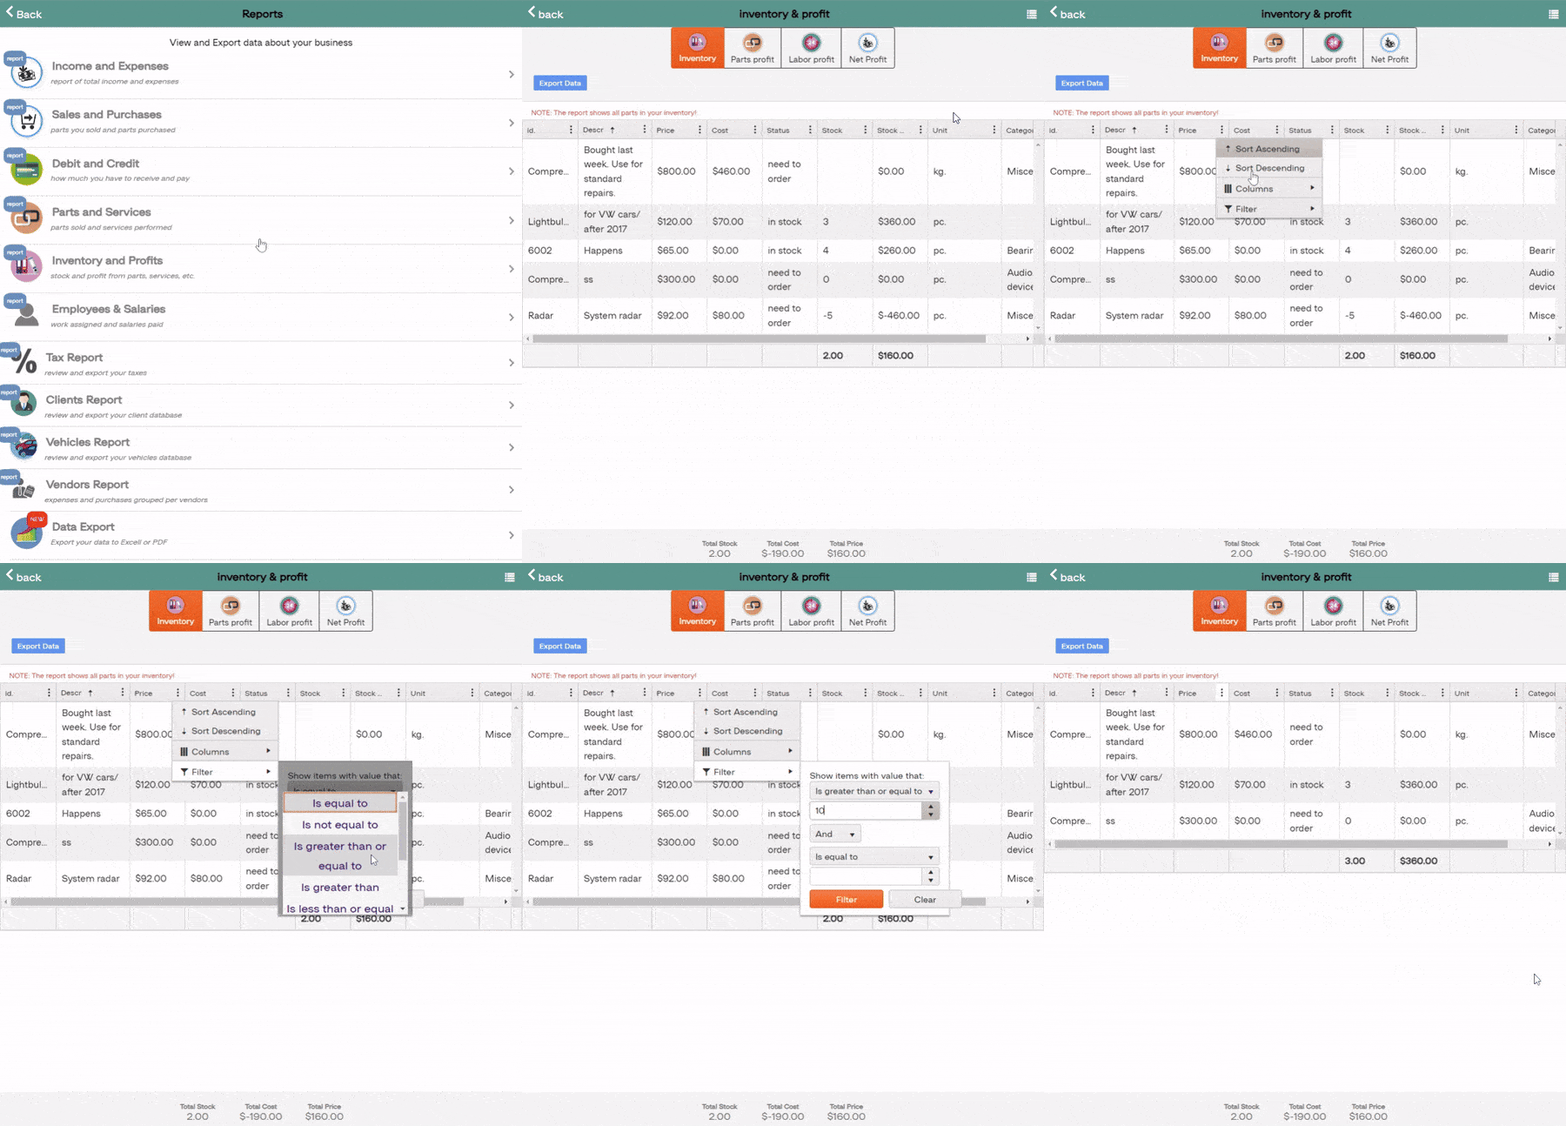
We’ve added some extra functionalities in the ‘Reports’ section so you can navigate faster and easily handle business. Here are the changes:
Table View for Reports
Each report you open on a desktop device will have the Grid/ Table view as a default viewing mode. This allows you to sort and filter the data by certain parameters so only relevant items will appear. You can also add/ remove columns to change the final report. You can change back to the List view by clicking the top-right icon on the header. You can find more info about the Grid view’s sort/ filter capacities here.

Sales Tax Report
In both the Tax Report and Parts& Services Report now you will see a Sales Tax Report Breakdown.
The tax report section contains the type of taxes, their total, and which of them is taxable and non-taxable. You can use it for your reference since it’s still not exportable.
Data Export Options
ARI now supports PDF data Exports on top of the regular CSV files that Excel processes. To Generate such reports – go to Reports -> Data Export and select the data type you are interested in. The data is taken from your ARI account records(if there’s no data in your account the reports will be empty) and can be segmented into the following sections:
Clients
Parts Sold
Services Performed
Invoices& Estimates
Expenses
Vendors
Purchases
Vehicles
After you choose the desired data type – click ‘Generate Report‘ and the system will load the relevant data. You can then export it to Excel or as a PDF file.
*Simply choosing a different data type won’t generate a new report – you’ll need to click the ‘Generate Report’ button after you select the new data type to complete the process.


