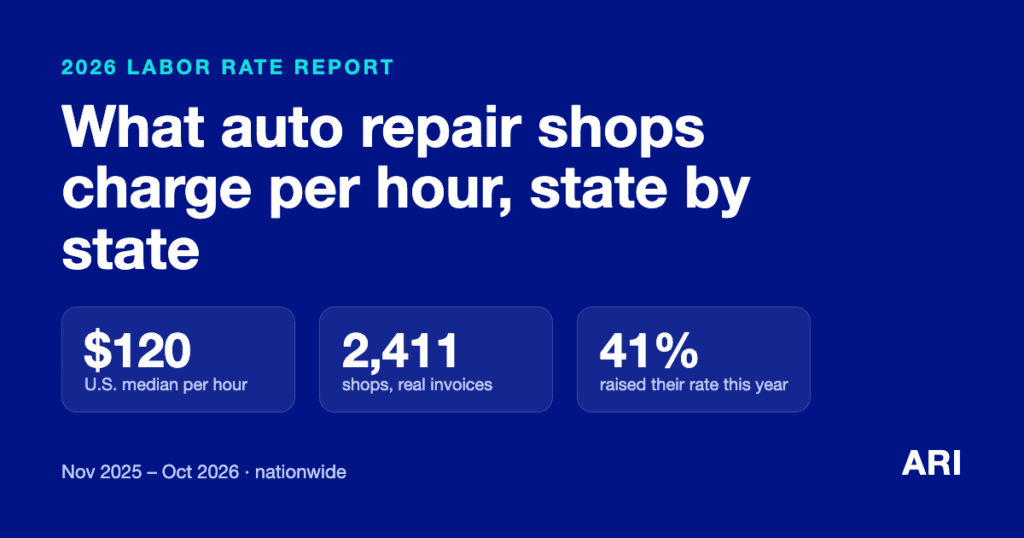
“What should I charge per hour?” It is one of the hardest questions in running a repair shop, and most owners answer it with a guess, a call to a friend across town, or whatever the last shop they worked at charged. We wanted to give shop owners something better: real numbers from real invoices.
We looked at the labor rates 2,411 auto repair shops across the United States actually billed their customers from November 2025 to October 2026, using anonymized, combined data from shops that run on ARI. Below you will find the typical rate in your state, the range around it, how rates change from big cities to small towns, and how many shops raised their rate this year. You can also check where your own rate falls.
Key takeaways
- The typical (median) U.S. auto repair shop charged $120 per labor hour. Half of shops charged between $99 and $135.
- Nevada ($138) and California ($135) had the highest median rates. At the other end, 12 states have a median of $100, including Ohio, Pennsylvania, North Carolina, Illinois and Kentucky.
- Location inside your state matters as much as the state itself: shops in large metro areas have a median of $120, against $100 in small towns and rural areas.
- 41% of shops raised their rate in the past year, usually by about $20 an hour. Only 4% lowered it.
- $100 an hour is the single most common rate, charged by 17% of shops.
Check your labor rate
Pick your state and enter your posted hourly labor rate. We will show you where it falls compared with other shops in your state.
Enter your state and rate above. If nothing appears, your browser is blocking scripts; the state table below has the same numbers.
Auto repair labor rates by state
Each row shows the middle half of shops in a state (the bar), the median shop (the dot) and the average (the line). States are sorted from the highest median to the lowest. The dashed line marks the national median of $120. Hover over or tap a state for its numbers.
Not shown because they have fewer than 10 ARI shops: Delaware, District of Columbia, Maine, North Dakota, Rhode Island, Vermont, Wyoming. See the regional table for these states.
Full state table
In every state the average and the median sit within $17 of each other. Where the average is higher, a few high-rate shops pull it up. Where it is lower, a group of lower-priced shops pulls it down. The median is usually the better comparison: half the shops in the state charge more and half charge less. Select a column heading to sort.
| Alabama | 53 | $109 | $110 | $100 | $125 | −$1 |
|---|---|---|---|---|---|---|
| Alaska | 10 | – | $130* | – | – | – |
| Arizona | 67 | $119 | $120 | $100 | $132 | −$1 |
| Arkansas | 17 | – | $110* | – | – | – |
| California | 220 | $133 | $135 | $100 | $150 | −$2 |
| Colorado | 56 | $122 | $120 | $100 | $150 | +$2 |
| Connecticut | 21 | $121 | $120 | $115 | $135 | +$1 |
| Delaware | under 10 | See South Atlantic in the regional table | ||||
| District of Columbia | under 10 | See South Atlantic in the regional table | ||||
| Florida | 192 | $116 | $120 | $100 | $140 | −$4 |
| Georgia | 97 | $114 | $120 | $100 | $130 | −$6 |
| Hawaii | 12 | – | $135* | – | – | – |
| Idaho | 32 | $116 | $115 | $98 | $136 | +$1 |
| Illinois | 69 | $108 | $100 | $95 | $125 | +$8 |
| Indiana | 42 | $106 | $100 | $86 | $128 | +$6 |
| Iowa | 30 | $109 | $102 | $91 | $125 | +$7 |
| Kansas | 28 | $118 | $125 | $104 | $130 | −$7 |
| Kentucky | 49 | $105 | $100 | $90 | $125 | +$5 |
| Louisiana | 18 | – | $120* | – | – | – |
| Maine | under 10 | See New England in the regional table | ||||
| Maryland | 49 | $115 | $120 | $95 | $140 | −$5 |
| Massachusetts | 45 | $118 | $120 | $100 | $145 | −$2 |
| Michigan | 48 | $104 | $100 | $89 | $116 | +$4 |
| Minnesota | 27 | $114 | $100 | $92 | $130 | +$14 |
| Mississippi | 23 | $113 | $115 | $100 | $125 | −$2 |
| Missouri | 46 | $114 | $110 | $96 | $135 | +$4 |
| Montana | 17 | – | $100* | – | – | – |
| Nebraska | 20 | $114 | $100 | $100 | $135 | +$14 |
| Nevada | 24 | $131 | $138 | $100 | $152 | −$7 |
| New Hampshire | 11 | – | $95* | – | – | – |
| New Jersey | 64 | $124 | $125 | $100 | $140 | −$1 |
| New Mexico | 14 | – | $120* | – | – | – |
| New York | 66 | $119 | $125 | $100 | $139 | −$6 |
| North Carolina | 80 | $111 | $100 | $95 | $125 | +$11 |
| North Dakota | under 10 | See West North Central in the regional table | ||||
| Ohio | 98 | $107 | $100 | $90 | $125 | +$7 |
| Oklahoma | 34 | $107 | $100 | $81 | $130 | +$7 |
| Oregon | 37 | $123 | $125 | $104 | $140 | −$2 |
| Pennsylvania | 91 | $105 | $100 | $85 | $125 | +$5 |
| Rhode Island | under 10 | See New England in the regional table | ||||
| South Carolina | 44 | $117 | $100 | $94 | $141 | +$17 |
| South Dakota | 14 | – | $80* | – | – | – |
| Tennessee | 58 | $115 | $105 | $96 | $125 | +$10 |
| Texas | 251 | $118 | $120 | $100 | $140 | −$2 |
| Utah | 32 | $122 | $120 | $99 | $149 | +$2 |
| Vermont | under 10 | See New England in the regional table | ||||
| Virginia | 69 | $116 | $110 | $100 | $130 | +$6 |
| Washington | 44 | $119 | $112 | $90 | $150 | +$7 |
| West Virginia | 17 | – | $95* | – | – | – |
| Wisconsin | 37 | $101 | $100 | $80 | $120 | +$1 |
| Wyoming | under 10 | See Mountain in the regional table | ||||
* States with 10 to 19 shops show the median only, rounded to the nearest $5. States with fewer than 10 shops are covered by their region below.
Labor rates by region
If your state has too few shops to report on its own, your region is the closest comparison. These are the nine regions the U.S. Census Bureau uses.
| Region | States | Shops | Average | Median | 25th pct. | 75th pct. |
|---|---|---|---|---|---|---|
| Pacific | AK, CA, HI, OR, WA | 323 | $130 | $130 | $100 | $150 |
| Mountain | AZ, CO, ID, MT, NV, NM, UT, WY | 247 | $120 | $120 | $100 | $142 |
| West South Central | AR, LA, OK, TX | 320 | $116 | $120 | $100 | $135 |
| New England | CT, ME, MA, NH, RI, VT | 96 | $116 | $120 | $96 | $136 |
| Middle Atlantic | NJ, NY, PA | 221 | $115 | $120 | $100 | $130 |
| South Atlantic | DE, DC, FL, GA, MD, NC, SC, VA, WV | 554 | $114 | $112 | $95 | $135 |
| West North Central | IA, KS, MN, MO, NE, ND, SD | 173 | $112 | $110 | $95 | $130 |
| East South Central | AL, KY, MS, TN | 183 | $110 | $110 | $100 | $125 |
| East North Central | IL, IN, MI, OH, WI | 294 | $106 | $100 | $90 | $125 |
| United States | 2,411 | $116 | $120 | $99 | $135 |
Big city or small town: location changes the picture
A state median hides a lot. Shops in metro areas with more than a million people have a median rate of $120. In smaller metros it is $110, and in small towns and rural areas it drops to $100. If you run a shop outside a big city, compare yourself with these numbers, not only with your state.
Area type is based on each shop’s ZIP code and the U.S. Census Bureau’s metro and micro area definitions. A micropolitan area is a town of 10,000 to 50,000 people with its surrounding county.
Labor rates in the largest metro areas
The 17 metro areas with at least 20 ARI shops, sorted by median. Los Angeles, CA leads at $150.
| Metro area | Shops | Average | Median | Middle half |
|---|---|---|---|---|
| Los Angeles-Long Beach-Anaheim, CA | 49 | $144 | $150 | $120–$160 |
| Denver-Aurora-Lakewood, CO | 25 | $128 | $135 | $100–$150 |
| New York-Newark-Jersey City, NY-NJ-PA | 63 | $127 | $125 | $102–$150 |
| Washington-Arlington-Alexandria, DC-VA-MD-WV | 46 | $118 | $125 | $100–$140 |
| Riverside-San Bernardino-Ontario, CA | 30 | $127 | $125 | $100–$150 |
| Austin-Round Rock-Georgetown, TX | 23 | $131 | $125 | $102–$152 |
| Dallas-Fort Worth-Arlington, TX | 54 | $124 | $122 | $100–$140 |
| Houston-The Woodlands-Sugar Land, TX | 70 | $116 | $120 | $100–$135 |
| Phoenix-Mesa-Chandler, AZ | 45 | $117 | $120 | $100–$135 |
| Philadelphia-Camden-Wilmington, PA-NJ-DE-MD | 42 | $118 | $120 | $100–$125 |
| Atlanta-Sandy Springs-Alpharetta, GA | 42 | $116 | $120 | $100–$125 |
| Miami-Fort Lauderdale-Pompano Beach, FL | 39 | $120 | $120 | $105–$138 |
| Orlando-Kissimmee-Sanford, FL | 28 | $121 | $120 | $100–$150 |
| San Antonio-New Braunfels, TX | 26 | $117 | $120 | $100–$144 |
| Chicago-Naperville-Elgin, IL-IN-WI | 46 | $110 | $100 | $95–$125 |
| Tampa-St. Petersburg-Clearwater, FL | 27 | $108 | $100 | $92–$125 |
| Charlotte-Concord-Gastonia, NC-SC | 25 | $106 | $100 | $85–$125 |
Are shops raising their labor rates?
Yes, and many of them. We compared the same 1,104 shops across two years. 41% raised their hourly rate in the last 12 months, 54% kept it the same and only 4% lowered it. The typical increase was $20 an hour, about 18%. Across all of these shops, the average rate went from $111 to $119.
Compares the 12 months to October 2025 with the 12 months to October 2026, for shops with enough invoiced work in both years.
Why so many shops charge exactly $100
Shop owners like round numbers. 17% of shops charge exactly $100 an hour, and 44% charge one of $100, $120, $125 or $150. That is why so many state medians land on exactly $100 or $120. It also means that when you raise from one round number to the next, you often pass a large group of shops at once.
Share of shops whose typical hourly rate is exactly this amount.
What to weigh before you change your rate
These numbers tell you what other shops charge. They cannot tell you what your shop should charge, because no other shop has your costs, your skills or your customers. A few things worth looking at alongside this data:
- Your true cost per billed hour. Add up wages, rent, insurance, equipment, software and everything else for a month, then divide by the labor hours you actually billed, not the hours your techs were in the building.
- Your effective labor rate. Divide total labor sales by billed labor hours. Discounts, comebacks and jobs quoted below book time can leave it well under your posted rate.
- What you specialize in. Diesel, European, hybrid and EV, ADAS calibration and diagnostic work often justify different rates from general repair.
- Your local market. Use the state, region and city-size numbers above, and remember that the shop down the road may not be in the same position as you.
- How you explain it. Customers accept a rate more easily when the estimate is clear, the work is documented with photos, and they know what they are paying for.
Frequently asked questions
What is the average auto repair labor rate in 2026?
Across 2,411 U.S. auto repair shops that use ARI, the median hourly labor rate was $120 and the average was $116 for November 2025 to October 2026. Half of shops charged between $99 and $135 an hour.
Which state has the highest auto repair labor rates?
Among states with at least 20 ARI shops, Nevada had the highest median labor rate at $138 an hour, followed by California at $135. Rates also run higher in large metro areas than in small towns, whatever the state.
Is the median or the average labor rate a better comparison?
The median is usually the better yardstick: half of shops charge more and half charge less. The average can be pulled up or down by a handful of shops with unusually high or low rates.
How often do auto repair shops raise their labor rate?
Of 1,104 shops we could compare across two years, 41% raised their hourly rate in the last 12 months, 54% kept it the same and 4% lowered it. The typical increase was $20 an hour.
How were these labor rates calculated?
For each shop we took the hourly rate it billed for the most labor hours on invoiced jobs of 1.5 hours or longer, using invoices created between October 28, 2025 and October 28, 2026. Every figure combines at least 10 shops, and no individual shop can be identified.
How we measured this
- Who is included: 2,411 U.S. auto repair shops with an active ARI subscription and at least 10 invoiced labor jobs of 1.5 hours or longer in the period, in all 50 states and Washington, D.C. Puerto Rico is not included.
- The period: invoices created between October 28, 2025 and October 28, 2026. Estimates, quotes and work the customer declined are not counted.
- What “labor rate” means: for each shop, the hourly rate it billed for the most labor hours on jobs of 1.5 hours or longer. Shorter jobs are left out because oil changes, inspections and other flat-priced services often show up as one-hour lines at their flat price. This matches the rate shops set in ARI in 97% of the cases we could check.
- Exclusions: 49 shops whose typical rate came out under $40 an hour were left out, because that almost always reflects per-item pricing rather than an hourly rate.
- Privacy: every number combines at least 10 shops. No shop, owner or customer can be identified.
- Limits: ARI shops are not a random sample of every shop in the country, and these are the rates shops charged, not a recommendation.
Know your own numbers. ARI is shop management software for auto repair shops: estimates, invoices, labor guides, inspections and payments in one place.
Get started with ARI