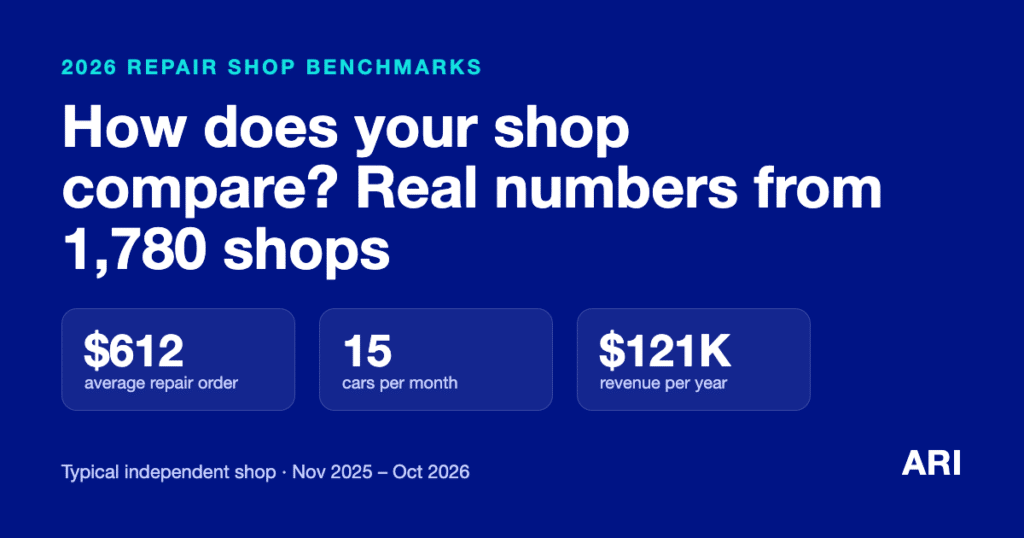
“How is my shop doing compared with others?” Industry surveys answer with averages that mix dealerships, chains and independent shops, and they often rely on owners’ own estimates. We looked at what independent shops actually invoiced.
We analyzed 568,266 repair orders from 1,780 independent auto repair shops across the United States that run on ARI, from November 2025 to October 2026. Below you will find the key numbers every shop owner tracks (average repair order, car count and revenue), how they vary by region and city size, what the busiest shops do differently, and a tool to see where your own shop stands.
Key takeaways
- The typical independent shop is small. It invoiced about 15 cars a month, at an average of $612 per repair order, for about $121K a year.
- Car count separates shops more than ticket size does. The top quarter of shops by revenue saw about 6 times as many cars as the bottom quarter, but their average repair order was only about 1.9 times as large.
- Top shops also price differently. Their median labor rate was $125 an hour against $100, and they marked up parts 36% against 27%.
- Small-town shops write repair orders as large as city shops. The typical average repair order ranged only from $566 to $623 between big cities and rural areas.
- Business grew this year. Among shops we could compare across both years, 60% saw more cars and the typical shop’s car count rose about 9%, with average repair orders up about 5%.
Benchmark your shop
Enter your numbers for a typical month. We will show where your shop falls among 1,780 independent shops.
Enter your cars per month and average repair order above. If nothing appears, your browser is blocking scripts; the tables below have the same numbers.
What a typical independent shop looks like
The middle of each row is the typical (median) shop. The other numbers show where the lower and upper ends of the range sit: a shop at the 75th percentile is ahead of three quarters of shops.
Cars invoiced per month
Average repair order
Revenue per year through ARI
A single repair order is usually smaller than a shop’s average: the typical repair order was about $360, while a few large jobs pull each shop’s average up to around $612. Labor made up about 53% of the typical bill.
What the top 25% of shops do differently
We split shops into four equal groups by revenue and compared the typical shop in each. The top quarter brought in about 9 times as much as the bottom quarter. Most of that gap comes from how many cars they see, not from bigger tickets.
| Median shop in each group | Top 25% | Upper middle | Lower middle | Bottom 25% |
|---|---|---|---|---|
| Revenue per year (through ARI) | $384K | $168K | $89K | $42K |
| Cars per month | 45 | 21 | 12 | 8 |
| Average repair order | $800 | $693 | $632 | $420 |
| Hourly labor rate | $125 | $125 | $120 | $100 |
| Parts markup | 36% | 32% | 30% | 27% |
| Labor share of the bill | 49% | 54% | 54% | 57% |
| Vehicles back within the year | 27% | 25% | 23% | 22% |
Groups are cut by revenue, so they describe how top shops look rather than proving what made them top shops. Parts markup covers shops that record part costs; labor rate is the rate each shop billed most often on jobs of 1.5 hours or more.
Three patterns stand out. Top shops see more cars, and a larger share of their vehicles come back within the year (27% vs. 22%). They charge more per hour and earn more on parts, which is why labor is a smaller share of their bills (49% vs. 57%).
Average repair order by region
Regional differences are smaller than most owners expect. The typical average repair order ranges from $541 to $680 across the nine U.S. Census regions.
| Region | Shops | Average repair order | Middle half | Cars / month | Revenue / year |
|---|---|---|---|---|---|
| Mountain | 158 | $680 | $450–937 | 14 | $121K |
| West South Central | 241 | $663 | $460–973 | 15 | $140K |
| Pacific | 243 | $633 | $412–921 | 16 | $128K |
| New England | 74 | $632 | $488–916 | 16 | $137K |
| West North Central | 125 | $593 | $421–943 | 17 | $135K |
| East South Central | 125 | $590 | $412–868 | 14 | $95K |
| South Atlantic | 415 | $565 | $378–842 | 14 | $110K |
| Middle Atlantic | 187 | $548 | $362–769 | 19 | $128K |
| East North Central | 212 | $541 | $421–784 | 16 | $111K |
Big city or small town
Labor rates are lower outside big cities, but repair orders are not much smaller. Rural and small-town shops write repair orders close to the national typical shop (the dashed line).
Typical shop’s average repair order by area type, based on each shop’s ZIP code and the U.S. Census Bureau’s metro and micro area definitions. Dashed line: all shops ($612).
Is business growing?
For most shops, yes. We compared 873 shops that were busy in both of the last two years. 60% invoiced more cars this year than last, and 60% raised their average repair order. The typical shop’s car count grew about 9% and its average repair order about 5%.
The busiest months and days
Repair work rises from spring, peaks in July and October, and slows in the winter holiday months. The swing is moderate: the busiest month is about 9% above an average month and the slowest about 10% below.
Each month’s invoices compared with an average month (1.00×), for shops open all year in 2024 and 2025.
During the week, Tuesday and Monday are the busiest days, and work tapers toward the weekend.
Share of invoices by the day they were created (Central time).
What this means for your shop
- Car count is the biggest lever. The gap between top and bottom shops is mostly volume. Service reminders, follow-ups on postponed work and easy online booking all bring cars back.
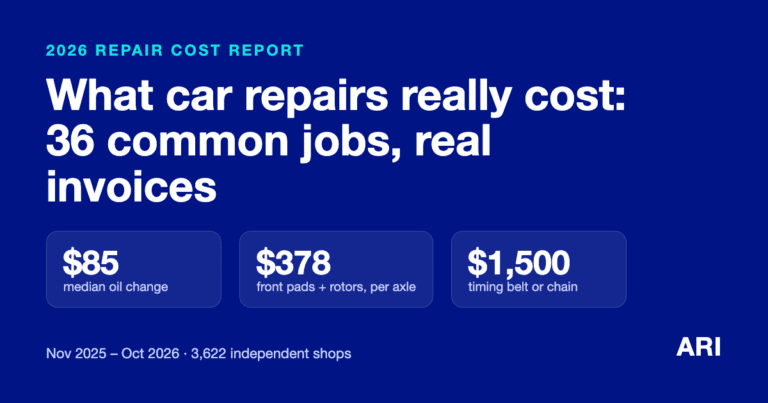
- Know your average repair order. Thorough inspections with photos help customers approve the work their car needs. See what common jobs cost in our report on what car repairs really cost in 2026.
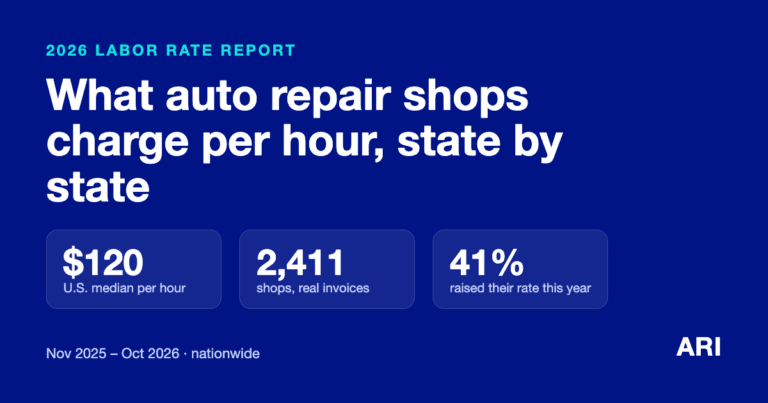
- Check your pricing. Top shops charge more per hour and earn more on parts. See how your rate compares in our auto repair labor rates by state report.
- Plan for the calendar. Summer and fall are busiest, and the winter holidays are slow. Early-week days carry the most work.
Frequently asked questions
What is the average repair order for an auto repair shop in 2026?
Among 1,780 U.S. independent shops using ARI, the typical shop's average repair order was $612 from November 2025 to October 2026, and the middle half of shops averaged between $417 and $885. The median single repair order was about $360, because a few large jobs pull the average up.
How many cars does an auto repair shop work on per month?
The typical shop invoiced about 15 cars a month. A quarter of shops invoiced fewer than 9, and the busiest quarter more than 30.
How much revenue does a small auto repair shop make?
The typical shop invoiced about $121K a year through ARI, and the middle half between $65K and $239K. The top quarter of shops had a median of $384K.
What separates the top auto repair shops from the rest?
Mostly car count. The top quarter of shops by revenue invoiced about 6 times as many cars a month as the bottom quarter, while their average repair order was about 1.9 times as large. They also charged higher labor rates ($125 vs. $100 an hour) and higher parts markups (36% vs. 27%).
What is the busiest day for auto repair shops?
Tuesday and Monday had the most invoices, about 19% and 19% of the week. Saturday accounted for about 7% and Sunday about 3%.
How we measured this
- Who is included: 1,780 U.S. auto repair shops with an active ARI subscription and at least 60 invoices in the period (invoices created between October 28, 2025 and October 28, 2026).
- Repair order: one invoice, valued as its labor plus parts before tax, excluding declined work. Invoices under $10 or over $30,000 are left out.
- Average repair order is each shop’s average over the year; the figures shown are the typical (median) shop. Cars per month is invoices per month. Revenue is the total invoiced through ARI; some shops do not invoice all of their work in ARI, so it can understate a shop’s full revenue.
- Repeat vehicles: share of a shop’s vehicles invoiced more than once in the year.
- Privacy: every figure combines at least 70 shops. No shop, customer or vehicle can be identified.
- Limits: ARI shops are independent shops and not a random sample of every shop in the country. These are descriptions of what shops invoiced, not recommendations.
See your own numbers every month. ARI is shop management software for auto repair shops: estimates, invoices, inspections, reminders, payments and reports in one place.
Get started with ARI